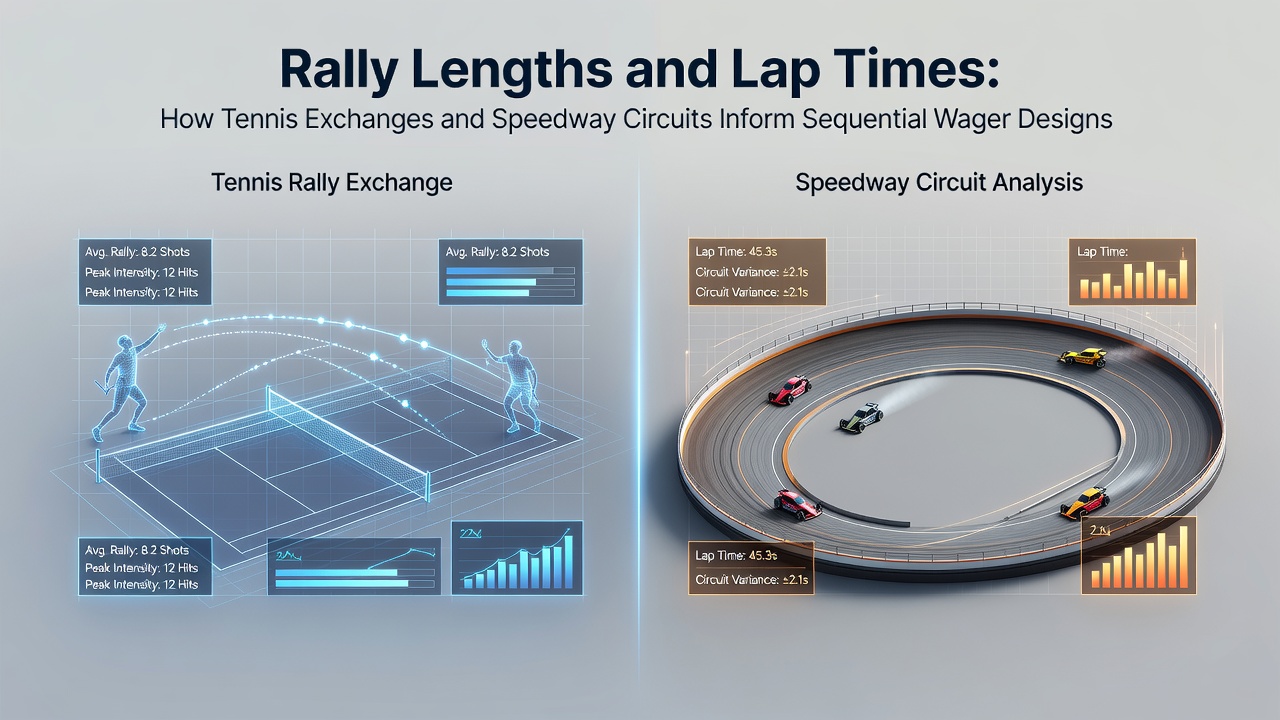
Rally Lengths and Lap Times: How Tennis Exchanges and Speedway Circuits Inform Sequential Wager Designs
Sequential wager designs draw on measurable patterns from tennis exchanges and speedway circuits to structure bets that unfold across multiple stages. Observers note how average rally durations in professional tennis matches provide data points on point progression rates while lap time variations on speedway tracks reveal consistency metrics that influence multi-leg betting sequences. These elements combine when bookmakers and data analysts construct accumulator frameworks where each successive outcome depends on timing thresholds established from prior legs.
Tennis Rally Metrics and Exchange Dynamics
Professional tennis matches generate extensive datasets on rally lengths that extend from brief exchanges under four shots to extended rallies exceeding fifteen strokes. Research from sports analytics groups indicates that clay court surfaces produce longer average rallies compared with grass courts, and this distinction affects the pacing of sequential bets tied to game or set progressions. Data shows players maintain higher win probabilities after short rallies on faster surfaces, yet longer exchanges shift momentum toward defensive specialists who sustain pressure across consecutive points. Analysts track these shifts to calibrate wager models that require bettors to predict sequences of point outcomes rather than single events, and the resulting structures reward accurate forecasting of rally length distributions within individual games.
Those who examine Grand Slam statistics find that rally length variance increases during later rounds when fatigue influences shot selection and error rates. Sequential designs incorporate these variances by assigning weighted probabilities to each leg, allowing accumulators to reflect real match conditions instead of static odds. One study released in early 2026 highlighted how baseline rallies on hard courts cluster around seven to nine shots, providing a reliable benchmark for designers who build progressive payout structures around point-by-point sequences.
Speedway Circuit Lap Times and Performance Consistency
Speedway racing delivers lap time data that captures both average speeds and deviation ranges across multiple heats on the same circuit. Tracks with tighter bends produce greater lap time spreads because riders adjust throttle and line choices in response to track conditions and competitor positioning. Figures from European motorsport federations reveal that elite riders maintain lap time consistency within 0.3 seconds across five-lap heats, and this precision informs wager sequences that hinge on cumulative finishing positions or heat results. Sequential designs use these consistency bands to set thresholds where bettors must correctly forecast whether a rider will post times inside or outside established margins during successive heats.
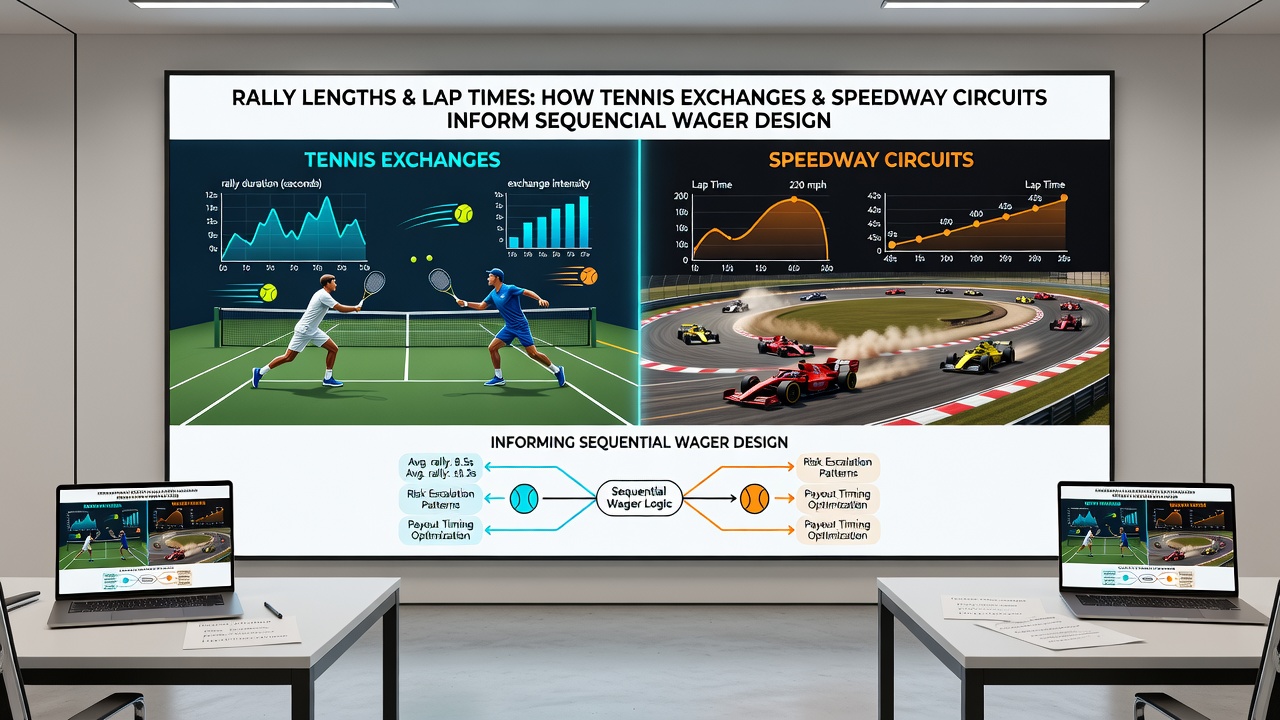
October 2026 schedules include several championship rounds where variable weather conditions widen lap time distributions, and wager platforms adjust sequential offerings accordingly. Riders who adapt quickly to changing grip levels generate narrower deviation ranges, and this adaptability becomes a key input when models assign probabilities to multi-heat accumulators. Observers note that circuits with longer straights compress lap time variance while shorter ovals amplify it, creating distinct risk profiles that designers embed into sequential bet frameworks.
Integrating Metrics into Sequential Wager Structures
Designers combine tennis rally statistics with speedway lap time profiles to create layered wager products that span both individual sports and cross-sport accumulators. A typical structure might require bettors to predict whether a tennis rally exceeds a set length before correctly forecasting a speedway rider's lap time bracket in the following heat. Data from academic research institutions demonstrates that such hybrid sequences reduce over-round margins when probabilities derive from empirical distributions rather than independent event odds. Analysts apply regression models that treat rally lengths and lap times as continuous variables feeding into discrete outcome legs, and the resulting frameworks allow for progressive stake adjustments based on early results within the sequence.
Industry reports from North American gaming associations illustrate how operators test these designs during major tournaments and championship series. Success rates improve when models account for surface-specific rally distributions in tennis alongside track-specific lap consistency in speedway, and operators refine thresholds after each event cycle. What's interesting is that cross-referencing these datasets produces more stable probability estimates for later legs in a sequence because early performance indicators carry predictive weight across both sports.
Practical Applications and Data Patterns
Bookmakers deploy sequential designs during high-profile events where both tennis and speedway competitions run concurrently. Bettors encounter offers that link a tennis player's rally success rate in one set to a speedway team's heat victory margin in the same evening program. Government statistical agencies in Australia publish periodic reviews of wagering product uptake, and those reviews show increased engagement with timing-based sequences when transparent data sources underpin the underlying metrics. Designers therefore prioritize publicly available rally and lap datasets to maintain regulatory compliance while delivering products that reflect measurable performance patterns.
Further refinement occurs when analysts segment data by player or rider profiles. Baseline specialists in tennis generate different rally length signatures than serve-dominant competitors, and these signatures translate into distinct sequence probabilities. Speedway riders with aggressive starting techniques post faster opening laps but wider overall spreads, and wager models incorporate these traits to differentiate payout tiers within the same accumulator. The approach yields structures that reward granular knowledge of both sports rather than broad outcome predictions.
Conclusion
Rally length distributions from tennis and lap time consistency measures from speedway supply quantitative foundations for sequential wager designs that extend across multiple legs. Data indicates these metrics enable more precise probability assignments when designers construct accumulators that depend on timing thresholds and performance ranges. Continued collection of match and race statistics supports iterative improvements to these frameworks, and operators apply the resulting models across varied event calendars without reliance on single-sport assumptions.